🔄 Brainstorm to Gantt: The Automated Workflow
The Project Controls Whiteboard bridges the gap between fast-paced, creative brainstorming sessions and rigorous, quantitative project controls (Critical Path Method scheduling, 5×5 risk ranking, and Earned Value Management). Instead of manually transcribing post-it notes into scheduling software, the whiteboard acts as a live, computational schedule engine.
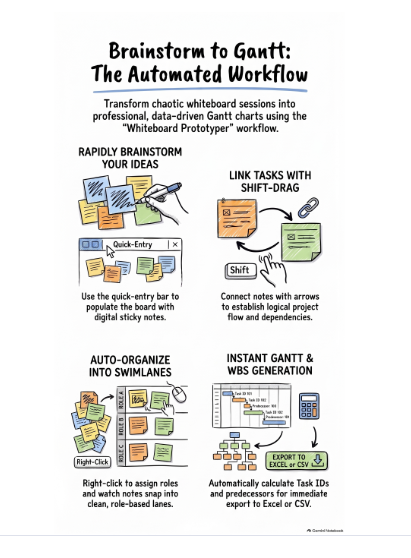 Figure 1: The 4-step "Whiteboard Prototyper" automated workflow — transforming collaborative board brainstorming into structured role swimlanes, CPM schedules, and Excel/Power BI datasets.
Step 1 Rapidly Brainstorm Ideas
Use the top quick-entry bar (Write task & Enter) or press N to populate the board with digital sticky notes. Capture work packages, scope elements, and milestones on the fly.
Step 2 Link Tasks with Shift-Drag
Hold Shift and drag from one note to another to draw dependency arrows. The engine automatically creates directional Finish-to-Start (FS) predecessors for CPM scheduling.
Step 3 Auto-Organize into Swimlanes
Right-click notes to assign disciplines/roles (e.g. Engineering, Procurement, Fabrication, Commissioning), duration, hours, costs (BAC), and risk scores. In the 🏊 Swimlanes tab, click Apply & Arrange Canvas Board to auto-align notes into clean sequential lanes.
Step 4 Instant Gantt, Risk & EVM
Automatically calculate Task IDs, predecessors, critical path days, and early start/end dates in the 📊 Gantt view. Track risks in the ⚠️ Risk Matrix and view real-time CPI/SPI with direct-labeled S-Curves in 📈 EVM. Export to CSV for Excel and Power BI with one click.
📝 Rapid Brainstorming & Sticky Note Data Model
Every sticky note on the canvas is a fully parametric Work Breakdown Structure (WBS) work package containing duration, effort hours, cost baselines, and risk metrics.
Pro-Tip: Press N and click anywhere on the canvas to place a note, or type task titles in the top bar's "Write task & Enter" field and press Enter to rapidly drop notes in succession.
Sticky Note Parameters & Controlling Fields
| Field Name |
Description |
Usage & Impact on Calculations |
| Swimlane / Role |
Discipline, department, or lane |
Groups tasks into swimlanes (e.g. PM, Engineering, Procurement, Production, Quality) |
| Duration (Days) |
Planned calendar work days |
Used by the CPM engine to compute early/late finish dates and critical path length |
| Planned Hours |
Estimated labor work hours |
Tracks man-hours for resource leveling and labor productivity analysis |
| Planned Cost (BAC) |
Budget at Completion in kr/currency |
Forms the financial cost baseline for Planned Value (PV) and Earned Value (EV) curves |
| Resource / Responsible |
Assigned person, team, or vendor |
Appears in the Risk Register and WBS schedule assignments |
| Risk & Impact (1–5) |
Probability (1–5) × Impact (1–5) |
Calculates Weighted Risk Score (1–25) and positions note in the 5×5 Risk Matrix |
Color Coding Conventions (Edward Tufte Muted Palette)
Use color purposefully to signal status, scope category, or risk severity:
- Slate — General task, default text, or administrative milestone.
- Blue — Planned baseline scope and engineering packages.
- Green — Completed milestones, favorable performance, or actuals.
- Red — Critical path tasks, high risk ($Score \ge 15$), or unfavorable cost/schedule variances.
- Yellow — Medium risk ($Score \ge 8$), warnings, or items under review.
🔗 Task Dependencies & Network CPM Modeling
Network logic determines the chronological sequencing of your project. By linking tasks directly on the canvas, you build an active mathematical dependency graph:
- Hold down the Shift key.
- Click and hold on the predecessor (starting) sticky note.
- Drag the cursor to the successor (target) sticky note and release the mouse.
- A blue directional arrow with an arrowhead is automatically rendered between note boundaries.
Multi-Predecessor Logic: When a task has multiple predecessors, its start date is automatically constrained by the predecessor with the latest finish date ($ES = \max(EF_{\text{predecessors}})$), strictly adhering to standard Critical Path Method (CPM) algorithms.
🏊 Swimlanes & Vertical Flowchart Diagram
The 🏊 Swimlanes tab automatically generates an executive-ready Vertical Swimlane Flowchart matching professional Google Slides and PowerPoint project presentation standards.
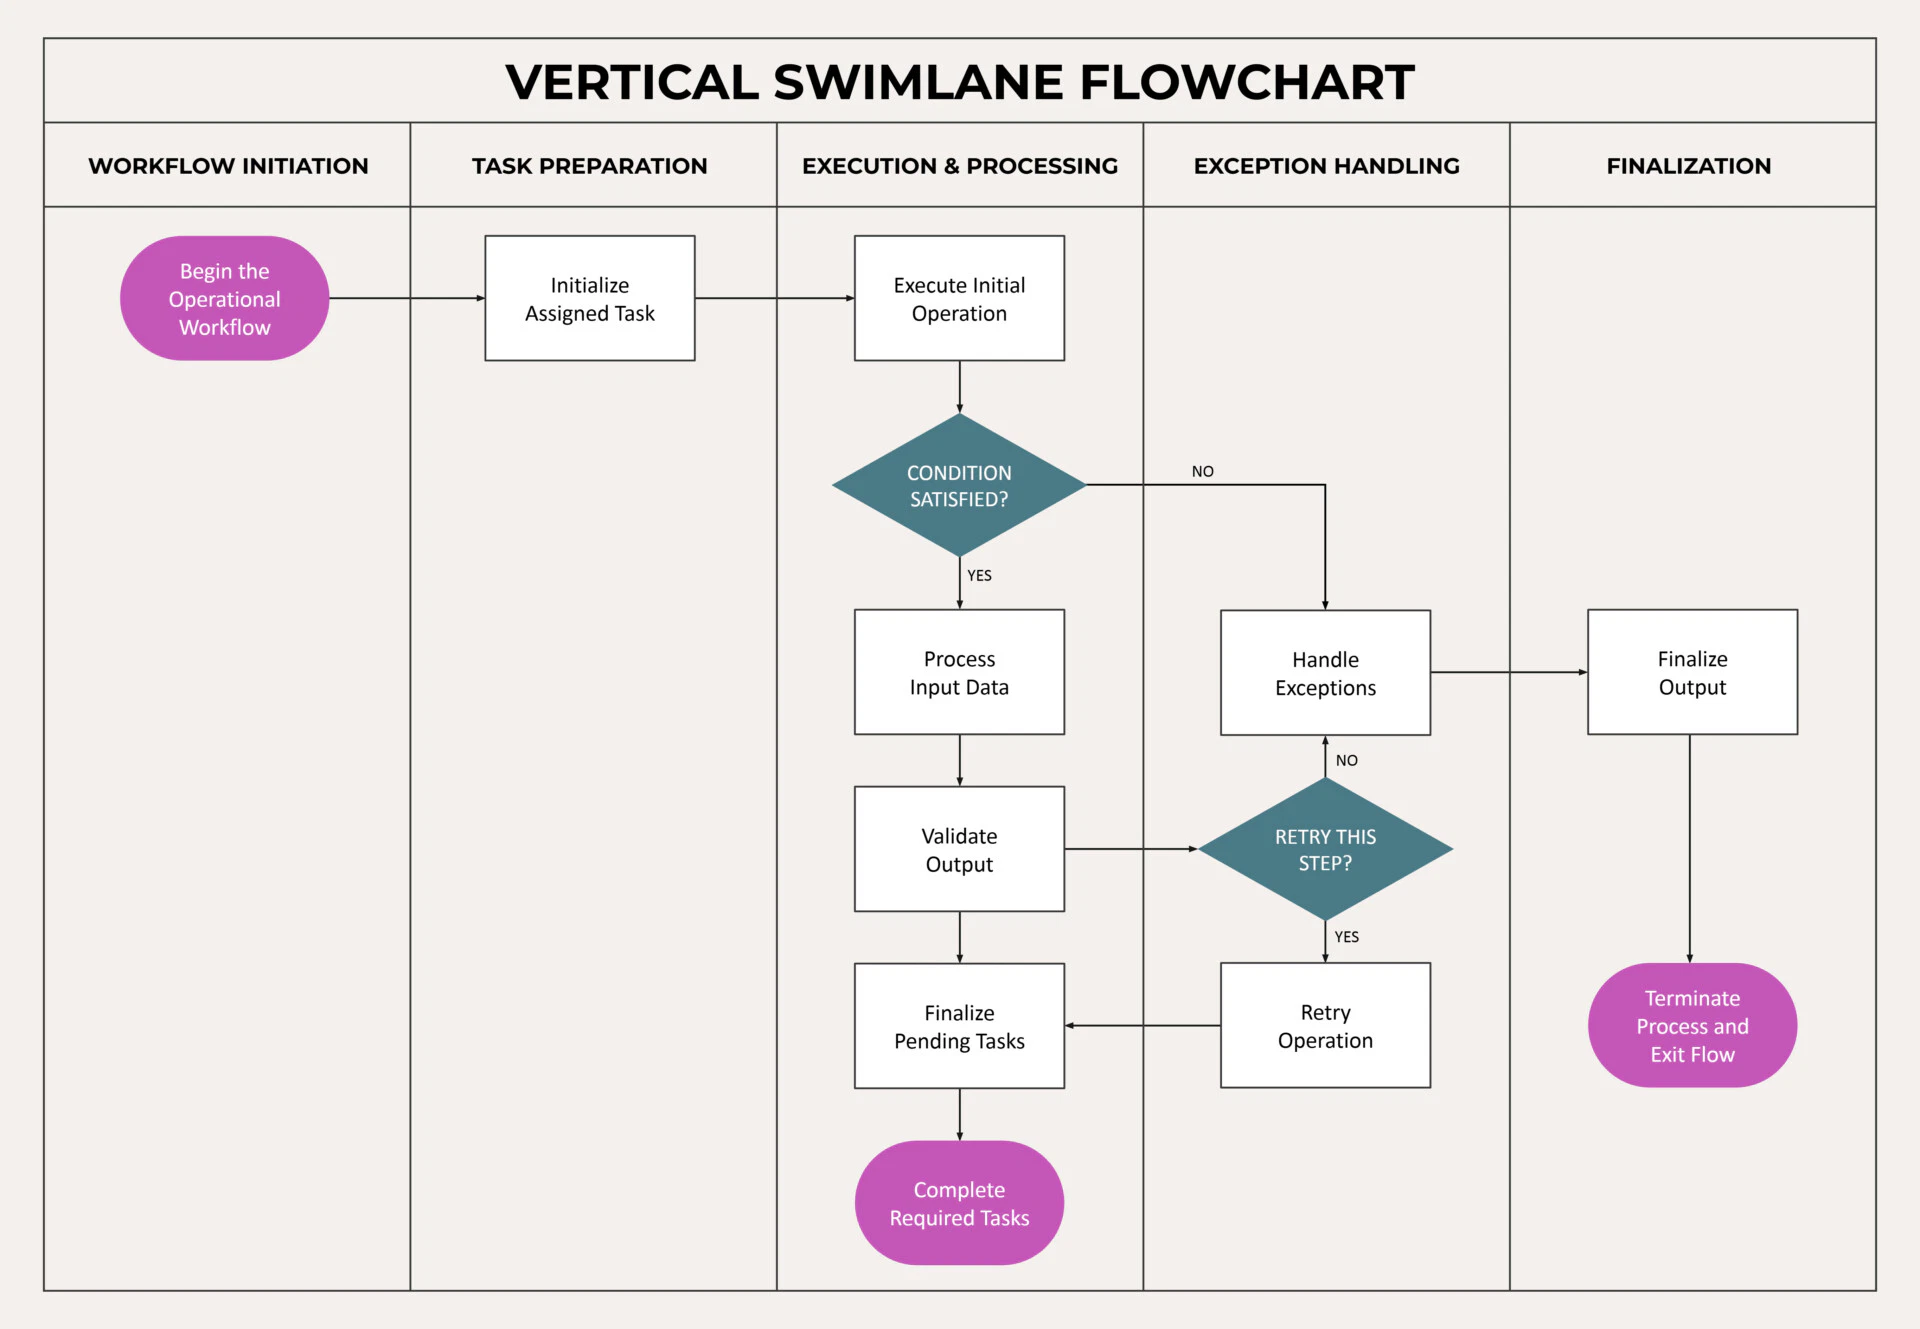 Figure 2: Vertical Swimlane Flowchart layout — cross-functional columns, initiation capsule (magenta), process boxes (white with WBS codes and planned cost), decision diamonds (teal), and terminal completion node.
- Cross-Functional Columns: Tasks are grouped vertically by role/discipline (e.g. Legal, Buy Shed, Clear Garden, Foundations, Install Shed).
- Decision Diamonds: High-risk tasks or questions (containing '?', 'review', 'permission', etc.) are automatically formatted as decision gates with YES/NO branch labels.
- Fit Height & Zoom: Use Fit Height or the + / − zoom controls to scale the entire end-to-end process onto your screen.
- Export Flowchart: Download high-resolution PNG images directly for management decks and project charter reviews.
📊 Gantt Schedule, CPM & WBS Table
The 📊 Gantt view presents a dual-pane schedule layout compliant with professional project management standards:
WBS Schedule Table (Left Pane)
A comprehensive 12-column table displaying Task ID, WBS Name, Role, Duration, Planned Hours, Cost, Predecessors, Actual Hours, Actual Cost, Progress %, Start Date, and End Date. You can edit actuals and progress inline!
Interactive Gantt Timeline (Right Pane)
A visual timeline displaying color-coded schedule bars, a red vertical Status Date marker, and a dedicated horizontal window roller slider to navigate wide project timelines smoothly.
Schedule Controls:
- Start Date: Sets the baseline kickoff date for the project schedule.
- Status Date: Sets the cutoff date for actuals, progress evaluation, and EVM variance calculations.
- Critical Path Calculation: Displays the calculated total project duration and highlights the longest path driving the completion date.
⚠️ 5×5 Risk Matrix & Risk Register
Risks assigned to sticky notes are automatically compiled into an ISO/PMI-standard 5×5 Risk Assessment Matrix:
$$\text{Weighted Risk Score} = \text{Probability (1–5)} \times \text{Impact (1–5)} \quad [\text{Range: } 1 \text{ to } 25]$$
- Low Risk (Score 1–7) — Muted slate/green background. Monitor through routine project governance.
- Medium Risk (Score 8–14) — Muted amber background. Requires mitigation strategy and active tracking.
- High Risk (Score 15–25) — Muted red background. Critical project risk requiring immediate escalation and contingency budget.
Below the matrix, the Risk Register table automatically ranks all work packages in descending order of risk exposure.
📈 Earned Value Management (EVM) & Tufte S-Curve
The 📈 EVM tab implements standard Earned Value Analysis for project controllers, tracking project performance against baseline commitments.
EVM KPI Formulas Reference
| Metric |
Formula |
Interpretation |
| Planned Value (PV) |
$\text{BCWS (Time-phased BAC to Status Date)}$ |
Approved budget assigned to scheduled work up to the Status Date |
| Earned Value (EV) |
$EV = \text{BAC} \times \text{Progress } \%$ |
Budgeted cost of work actually performed ($\text{BCWP}$) |
| Actual Cost (AC) |
$\text{ACWP (Total incurred actual expenditure)}$ |
Total realized cost incurred for work completed |
| Cost Variance (CV) |
$CV = EV - AC$ |
Positive ($>0$) = under budget; Negative ($<0$) = cost overrun |
| Schedule Variance (SV) |
$SV = EV - PV$ |
Positive ($>0$) = ahead of schedule; Negative ($<0$) = delayed |
| Cost Index (CPI) |
$CPI = EV / AC$ |
$CPI > 1.0$: cost efficient; $CPI < 1.0$: overspending |
| Schedule Index (SPI) |
$SPI = EV / PV$ |
$SPI > 1.0$: progressing faster than plan; $SPI < 1.0$: behind |
| Forecast (EAC) |
$EAC = \text{BAC} / CPI$ |
Estimate at Completion — forecasted total project cost |
| Estimate to Complete (ETC) |
$ETC = EAC - AC$ |
Expected remaining cost required to finish the project |
| Variance at Completion (VAC) |
$VAC = \text{BAC} - EAC$ |
Expected final variance (positive = budget surplus) |
Edward Tufte Data-Ink S-Curve Principles
The S-Curve canvas is rendered strictly following Edward Tufte's Data-Ink maximization principles:
- Direct Labeling: Labels (Planned / Baseline, Earned Value, Actual Cost) are written directly adjacent to the curves, removing the cognitive burden of disconnected legend boxes.
- Status Date Variance Callouts: A dedicated dashed vertical inspection line at the Status Date displays visual delta brackets for Cost Variance ($CV$) and Schedule Variance ($SV$) with explicit $+/-$ amounts and percentage variances.
- Zero Chartjunk: Vertical gridlines and heavy drop shadows have been removed to highlight the project trajectory cleanly.
🎨 Canvas Drawing Tools & Vector Shapes
The whiteboard canvas supports full freehand sketching and vector annotations for project diagrams, architecture sketches, and meeting notes:
- Select & Move (S): Click and drag vector shapes or select elements on the canvas.
- Pen (P): Crisp freehand pen drawing with responsive stroke width.
- Highlighter (H): Semi-transparent marker for highlighting schedule paths, areas, or notes.
- Eraser (E) & Area Eraser: Erase individual strokes or drag a bounding box to delete all enclosed items.
- Shapes: Line (L), Rectangle (R), Circle (C), Arrow (A), Diamond (D), Triangle (T).
- In-Shape Text: Double-click any geometric shape on the canvas to type inline labels and milestones!
⌨️ Keyboard Shortcuts & Hotkeys Cheat Sheet
| Key Combination |
Tool / Action |
Description |
| S |
Select Tool |
Select and move vector elements |
| P |
Pen Tool |
Freehand drawing |
| H |
Highlighter Tool |
Translucent highlighting |
| E |
Eraser Tool |
Erase strokes under cursor |
| L |
Line Tool |
Draw straight lines |
| R |
Rectangle Tool |
Draw rectangles / boxes |
| C |
Circle Tool |
Draw circles / ellipses |
| A |
Arrow Tool |
Draw directional arrows |
| D |
Diamond Tool |
Draw decision diamonds / milestones |
| T |
Triangle Tool |
Draw triangles / delta markers |
| N |
Add Sticky Note |
Place a new sticky note on canvas |
| Shift + Drag |
Connect Sticky Notes |
Create predecessor/successor dependency arrow |
| Ctrl + Z |
Undo |
Undo previous canvas or note action |
| Ctrl + Y |
Redo |
Redo previously undone action |
| ? or F1 |
User Guide |
Open this User Guide & Workflow dialog |
| Esc |
Close Modal |
Dismiss any active dialog or popup |
💾 File Management, Microsoft Excel & Power BI Export
The Project Controls Whiteboard operates 100% local-first. All data remains on your machine with zero cloud tracking:
- Save Board (JSON): Type a project name (e.g.
New Garden Shed) and click Save Board to download the complete vector strokes, notes, dependencies, and EVM data as a persistent .json file.
- Open File: Click Open File to load any saved project, such as the bundled sample project
samples/New Garden Shed.json.
- Export PNG: Export a high-resolution, print-ready image of your whiteboard sketches and notes for executive presentations.
- Export CSV (Excel): In the Gantt view, click Export CSV (Excel) to generate a semicolon-delimited CSV dataset configured for direct import into Microsoft Excel Power Query and Power BI DAX models.